Bollinger Band Formula, Calculation, Working and Trading Strategy
Bollinger Band Formula and Strategy: If you also invest and trade in stocks, then you must have heard the name of Bollinger Band trading strategy at one time or another. Because it is a very popular tool among investors and traders. But do you really have any information about this trading strategy, if not then you can continue this article because today in this article we are going from Bollinger Band trading strategy to its formula and about ways to understand the graph.
Before that, for your information, let us tell you that this is a stock indicator tool, with the help of which you are given information about the stock trend by a graph, and in this, you get to see two lines so that you can get less of the stock trend. Turns out to be more.
What is Bollinger Band, and what is its use in stock trading, know now some 2022
Let’s know about Bollinger Band and some of its important trading strategies, which you can use to ease your stock investment.
What is Bollinger Band?
This is the most popular stock market indicator tool or trademark chart among all investors and traders, developed by world-renowned trader John Bollinger, and which is exclusively used by investors. And in this you are shown a moving average line graph which is used to predict when the stock went overbought i.e. at which time it was overbought and when it was oversold.
And the main purpose of this Bollinger Bands indicator is to compare the relative definitions between the prices of the stock market to reach a right decision investor. So that people can make a systematic investment decision.
History of Bollinger Band trading strategy.
The Bollinger Bands statistical chart was discovered 40 to 50 years ago by John Bollinger in the 1980s. In which you get to know about the fluctuations of the market through a simple moving average graph.
And it was very simple and easy to use, hence it was very popular among investors even at that time.
What is Overbought and Oversold in Bollinger Band?
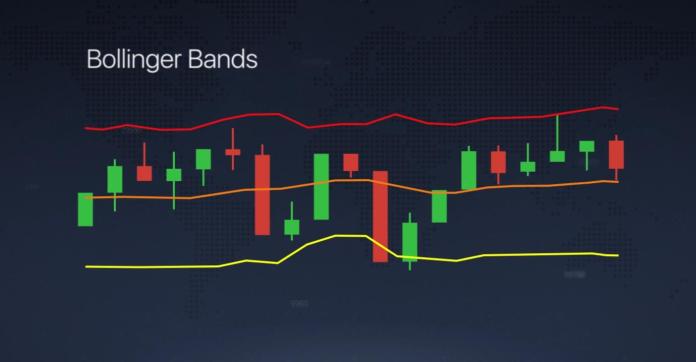
If you also do not have any information about overbought and oversold, then for your information, let us tell you that when you try to analyze the stock market price with the help of this indicator tool, then at that time you will get There are 2 lines visible, in which the top line is called Upper Band, and when the price of the stock moves towards the upper band, then we call it overbought in investor’s language.
And in the same indicator tool, the bottom line is called the lower band and when the price of the stock moves towards the lower band, then we call it oversold in investor’s language.
How to use the Bollinger Band Indicator Tool.
If you also want to analyze the stock market with the help of Bollinger Bands Indicator Tool, then for this you need to keep the following points in mind.
When you use this indicator tool, there you see two types of lines in which the upper line is called upper band and the lower line is called lower band. And the easiest and simplest way to use it is that you analyze both the bands well, ie the line given in the graph.
In such a situation, when the price of the stock moves towards the upper lines, then we call it overbought, whereas when the price of the stock moves towards the lower lines, we call it oversold.
And apart from this, when you see the price of the stock moving up and down in that indicator tool, it is called Band Expand, and when the stock prices are moving up and down at a slow pace then it is called Narrow Band or These are called Stock Sideways.
At the same time, when the price of the stock breaks both sides i.e. towards the upper band as well as towards the lower band, then the such a situation is called a breakout.
And the most important thing is that it usually sees a simple moving average of about 20 days. Only after that, some decisions are taken by the traders.
In this way, you can use this Bollinger Band Indicator tool keeping in mind the following things given above, and analyze the stock market prices well.
Bollinger Band trading strategy in English 2022
If you also want to trade in stocks with the help of the Bollinger Band trading strategy, then you can keep the following things in mind.
The first strategy is that whenever the stock crosses the upper band and together with the lower band towards the bottom, then in such a situation you should buy the stock.
And you should sell your stock when the graph approaches the lower band.
Note: Apart from this, for your information, let us tell you that you should not buy and sell any stock only by following the Bollinger Bands trading strategy, because it confirms only one indicator, so whenever you buy any stock Before doing the work of buying and selling, then buy and sell a stock only after gathering all the information through other means other than this strategy.
Bollinger Band Formula & Calculation
To calculate the middle band, you first need to add up estimated closing prices for 20 days, and then divide that value by 20.
Formula :
MBB(Middle Bollinger Band) + 20 days average closing prices / 20.
At the same time, to calculate the upper band, you have to calculate the moving average of the close, and then add the standard deviation to it.
Formula :
UBB (Upper Bollinger Band) – MB (Middle Band) + 2 x Standard Deviation
While to calculate the lower band, you have to calculate the moving average of the close and subtract the standard deviation from it.
Formula :
LBB (Lower Bollinger Band) – MB (Middle Band) – 2 x Standard Deviation
Some important things to understand are stock trends with the help of Bollinger Bands.
When you try to understand the stock trend with the help of Bollinger Bands, then you need to keep all these things in mind below. So that it becomes easier for you to trade in stocks.
When you see the stock prices going very low up and down in the graph, then you should understand that that stock is getting good Support and Resistance.
After that, when you see the price of the stock breaking the above lines, and at the same time it remains above for some time, then it is considered a Bullish Signal.
And when you see the price of the stock breaking the lower line and simultaneously staying down for some time, then it is considered a Bearish signal.
Then when the price of the stock starts coming down or towards the middle band through the Bullish phase, then I should understand that the Bullish Trend is Reversing.
At the same time, when the price of the stock starts moving from the lower band to the upper band or middle band, then you should understand that the Bearish Trend Reverse is happening.
Read Also:
SmallCase: New and easy technique For investing in Share market
What is SGX Nifty? SGX Nifty timings IST | what SGX Nifty affects the market
Bollinger Band Trading FAQ?
Q.How to use Bollinger Bands effectively?
Ans: To use Bollinger Bands effectively, first of all you should understand it properly by looking at the statistics graph and understand its formula very well.
Q.Does the Bollinger Bands strategy work?
Ans: Bollinger Bands’ strategy works even in today’s era because this group is still used by many investors and traders.
Q.How reliable are Bollinger Bands?
Ans : Bollinger Bands is a type of statistics graph tool, and it is used by investors even today, so even today it is a reliable tool for stock investors. But apart from this you cannot invest completely relying on its graph, apart from this you have to gather investment-related information through other means.
Q. Are Bollinger Bands support and resistance?
Ans: Yes, Bollinger Bands are support and resistance because when you see the prices moving up and down very rarely in the statistics graph, then there is a good support and resistance in such a situation.
Q.What happens when Bollinger Bands become narrow?
Ans: Bollinger Band Narrow ie Narrow occurs when the stock prices are moving up and down at a slow pace.
conclusion
Hope after reading this post you have got all kinds of information related to Bollinger Band Trading Tool rest as soon as you start using this indicator tool then you will get better information about it Will go For further information related to the rest of the stock market and share market, you can read other posts available on Hindiworld.